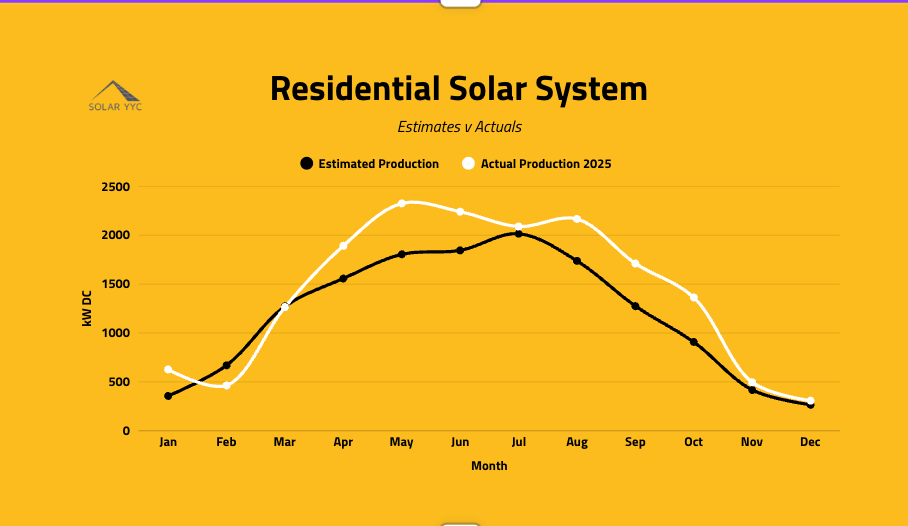
Yes. In this Solar YYC case study of two Calgary homes, both solar systems exceeded their estimated annual electricity production. System 1 generated 20% more energy than estimated, while System 2 produced 10% more. While monthly production fluctuates due to Alberta weather, annual solar yields are highly reliable.
A solar proposal estimates how much energy a system will generate over a year, but real-world variables like snow, cloud cover, and seasonal shifts impact actual electricity output.
To determine the accuracy of our models, we compared the original production estimates of two Solar YYC residential installations in Calgary against a full year of actual production data. The result: both systems produced more energy than originally projected.
Case Study 1: 36-Panel System (20% Above Estimate)
The first system was designed with 36 solar panels, an estimated 91% energy offset, and projected annual production of 14,125 kWh.
That seasonal production was also important to the homeowner’s energy strategy. Higher summer production could be exported through a Solar Club, helping generate credits that could offset electricity costs during lower-production months.
Designing Around the Home
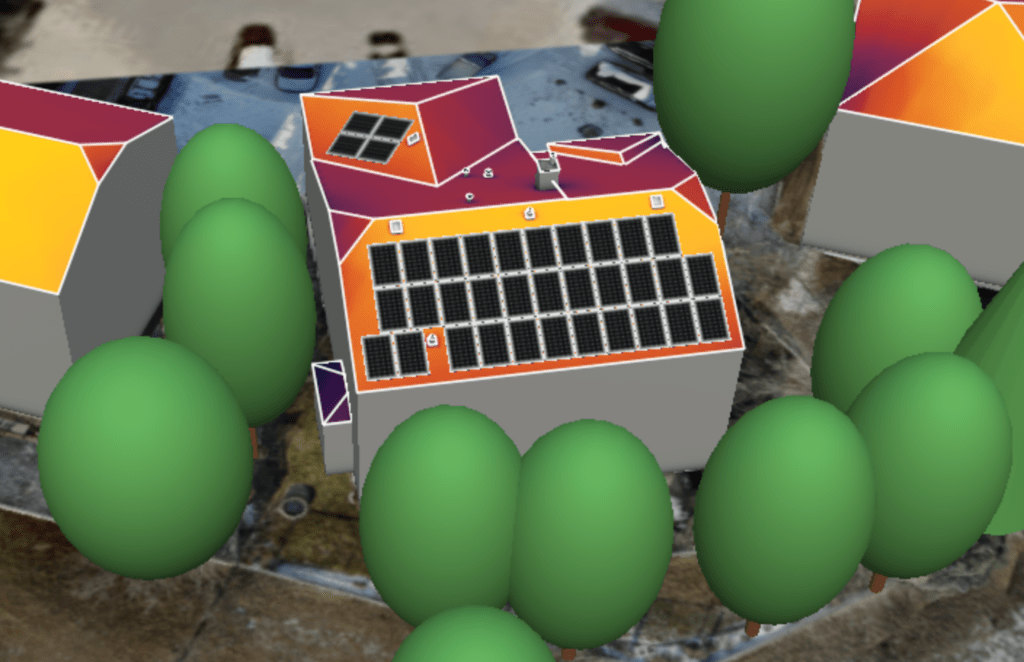
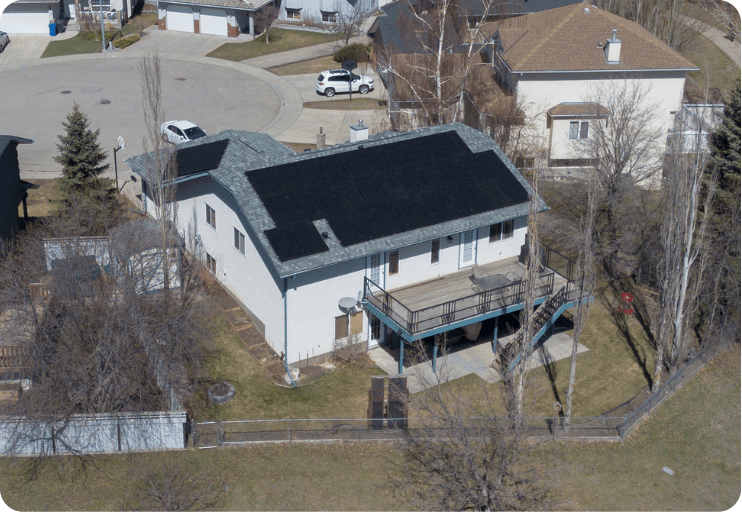
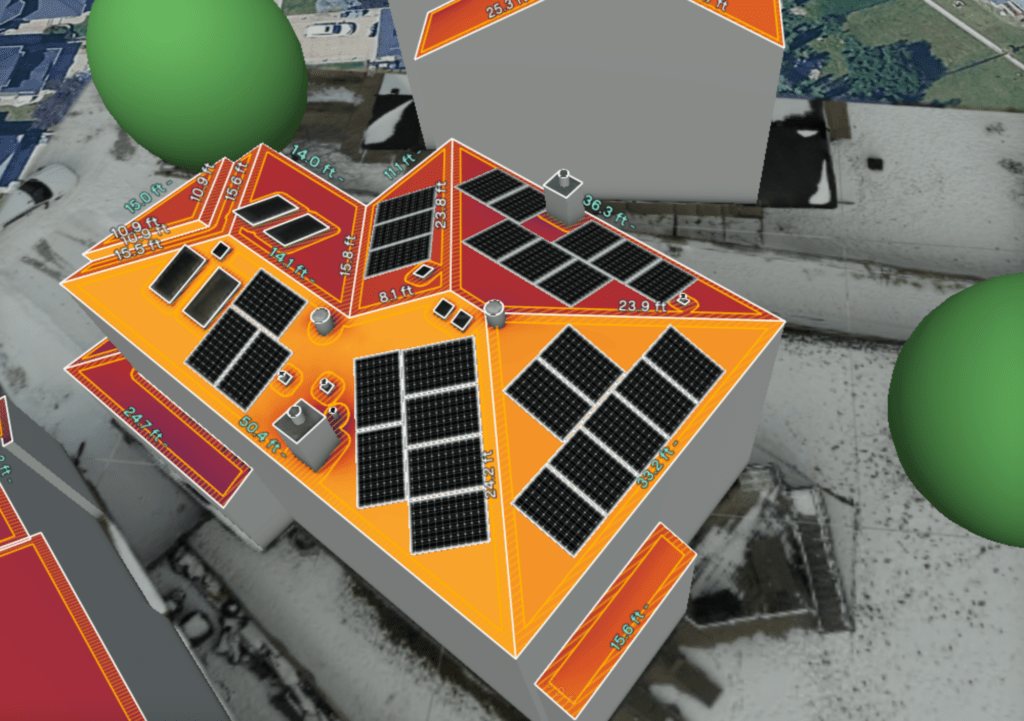
Before looking at the production numbers, it’s worth looking at how the system was designed. The thermal imagery helped our designers understand how sunlight moved across the property and identify the areas with the strongest solar potential. That information was then used to determine the optimal panel placement for the home.
What Was Estimated vs. What Actually Happened?
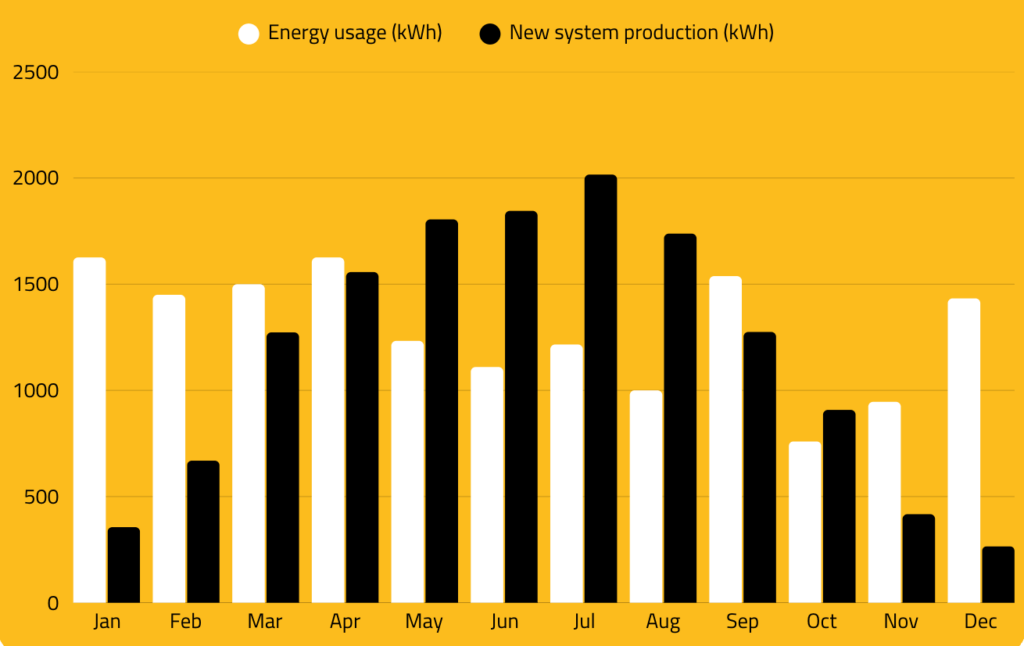
The monthly production follows the pattern you would expect from an Alberta solar system: generation builds through the spring, peaks during the brighter months, and then declines heading into winter.
But when we compare the estimated production with the actual production, things get more interesting.
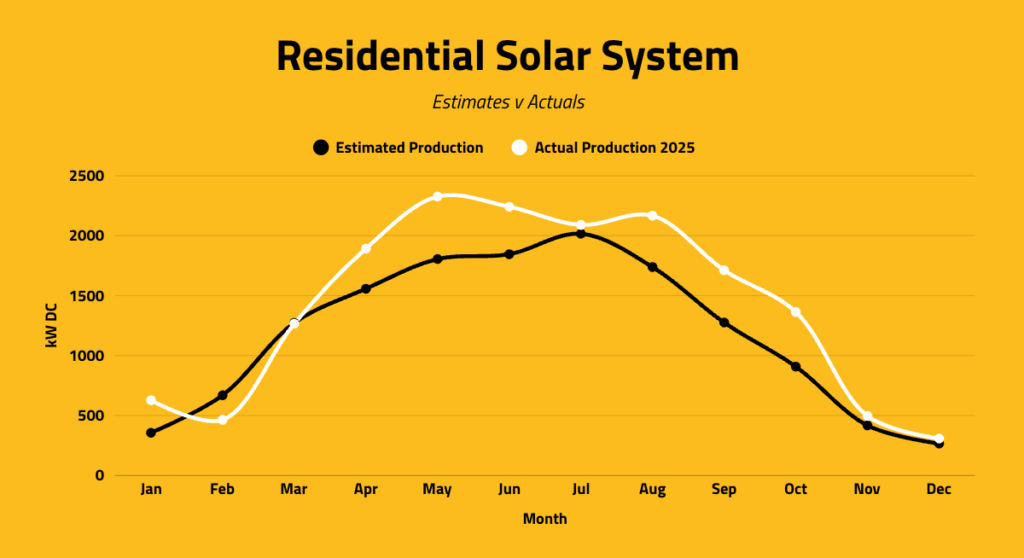
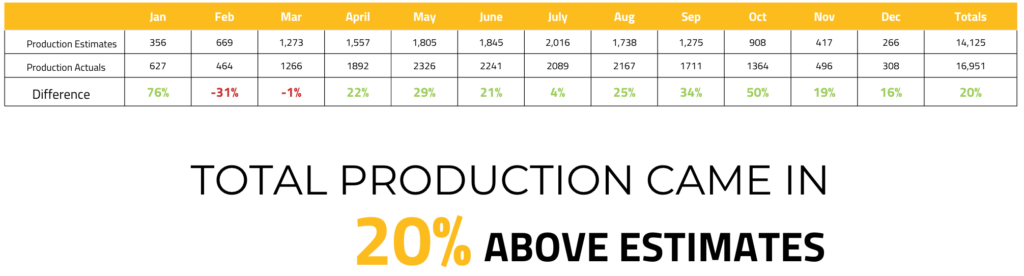
The original estimate projected 14,125 kWh of production for the year. The system actually generated 16,951 kWh. That means it finished the year 2,826 kWh above the original estimate, approximately 20% more than projected.
However, the system didn’t outperform the estimate evenly throughout the year.
In January, for example, the system generated 627 kWh, compared with an estimated 356 kWh. That’s approximately 76% more than projected. February went the other way, with actual production coming in below the estimate.
Then came October.
The system was expected to produce 908 kWh, but actually generated 1,364 kWh — approximately 50% more than projected. September was also well above estimate, coming in 34% higher. This is where looking at the entire year becomes important. A month that produces less than expected doesn’t necessarily mean the system is under performing. Likewise, one unusually strong month doesn’t tell the whole story. Production can move around considerably from month to month, while the annual total can still end up well above the original projection.
For this system, the stronger months more than made up for the weaker ones. By the end of the year, the difference was significant: 2,826 kWh more energy than originally estimated.
Case Study 2: 27-Panel System on a Complex Roof (10% Above Estimate)
This installation included 27 solar panels, with an estimated 92% energy offset and projected annual production of 9,653 kWh. This second home presented roof design challenges due to existing vents and a chimney. To maximize panel placement without going over the roof edges, Solar YYC completed a drone study to capture centimeter-level measurements.
How Did the Second System Perform?
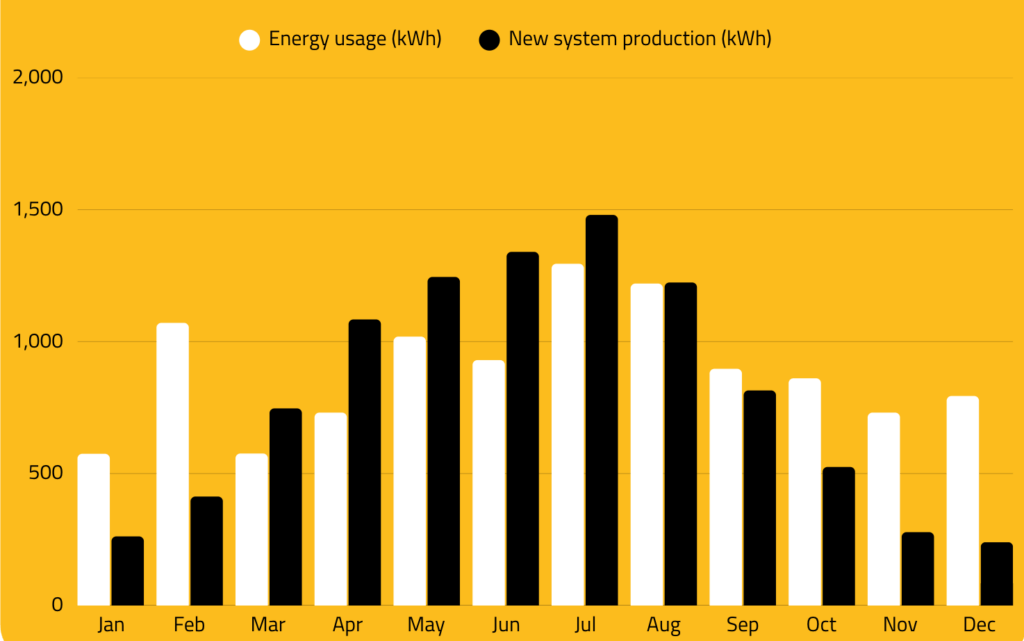
Just like the first system, production varied throughout the year. Spring and summer brought the strongest generation, while production declined through the fall and winter. But once again, the monthly results didn’t always match the original projection.
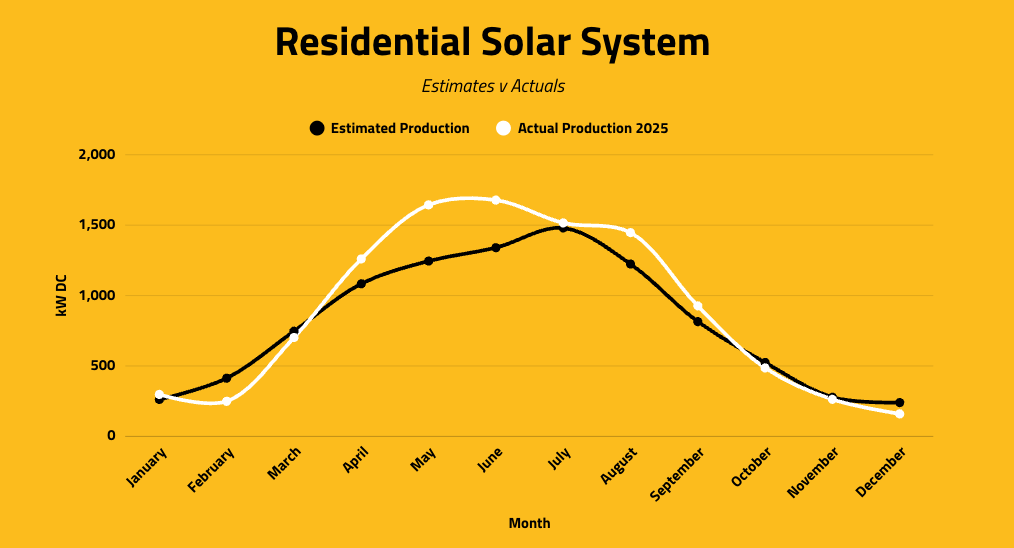
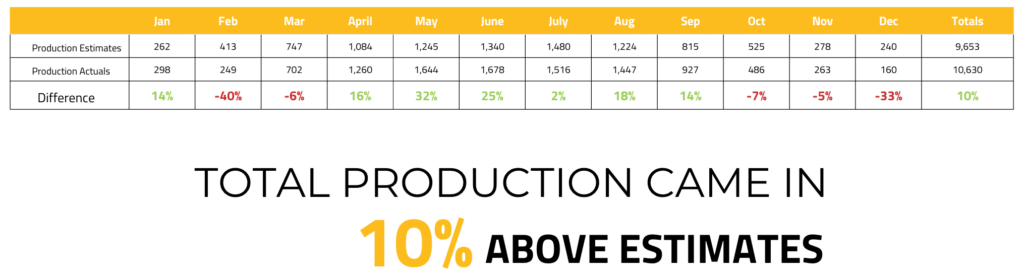
The system was estimated to produce 9,653 kWh over the year. It actually generated 10,630 kWh. That’s 977 kWh more than projected, approximately 10% above the original estimate. Just like the first system, there were some significant swings along the way.
February was approximately 40% below estimate, producing 249 kWh compared with 413 kWh projected. December was also below projection, generating 160 kWh compared with an estimated 240 kWh.
But then the stronger months started to add up.
In May, the system produced 1,644 kWh, compared with 1,245 kWh estimated approximately 32% above projection. June finished 25% above estimate, while August came in 18% higher. By the end of the year, those higher-production months had more than offset the months that came in below projection, resulting in 977 additional kWh of solar energy that wasn’t included in the original annual estimate.
What Can We Actually Learn From a Year of Solar Data?
Looking at these two systems side by side reveals something that a single production estimate can’t: solar performance isn’t perfectly predictable month to month, but the annual picture can still be remarkably strong. Both systems had months where production fell below the original projection. Both also had months where they significantly outperformed it. What mattered was how those differences added up over the full year.
The first system was projected to produce 14,125 kWh but generated 16,951 kWh — 2,826 kWh more than estimated, or 20% above projection.
The second system was projected to produce 9,653 kWh but generated 10,630 kWh — 977 kWh more than estimated, or 10% above projection.
That doesn’t mean every solar system will outperform its estimate by 10% or 20%. Production will always depend on the specific property, system design, weather and other real-world conditions. What these examples do show is why it’s important to look at solar production over the course of a full year rather than judging performance by any single month.
A month that falls short of its estimate doesn’t necessarily mean a system is under performing. And a particularly strong month doesn’t necessarily mean the system will continue at that level. For these two homes, that story was simple: both systems not only met their original production estimates, they exceeded them.